This article is Version 2. Version 1 can be found here.
In another post, we consider the theoretical causes for agglomeration economies in cities, which are the tendency for some per-capita socioeconomic quantities, such as wages and output per capita, to increase with city size. In this post, we will consider empirical results on how socioeconomic quantities scale with city size. We shall see that, while there is strong evidence that some quantities scale superlinearly or sublinearly with city size, the results and methodologies have been challenged.
Theoretical Scaling
Bettencourt (2013), operating from a physics perspective, derives a 7/6 power scaling law for socioeconomic rates in a city, including economic output. Equivalently, per capita output increases with the 1/6 power of size. Also equivalently, the elasticity of per-capita output with population is 1/6 = 0.1666…, or with a 1% increase in city size, we should expect about a 0.1666…% increase in per-capita output. While economic output, or GDP, is a focus, socioeconomic quantities cover a range of factors affecting a person’s life, including negative outcomes such as crime.
Bettencourt derives several additional scaling laws. Area should grow with the 2/3 power of population. Infrastructure lengths, such as the number of lane-miles of road and the length of all water pipes and power lines, grow with the 5/6 power of population. What Bettencourt calls “network power dissipation” grows with the 7/6 power of population. Analogizing the city’s function to an electrical network, power dissipation refers to quantities such as traffic throughput. Because power dissipation and output grow with the same exponent, we see that urban efficiency, the power required per unit output, is independent of city size.
Under Bettencourt’s model, cities form when the benefits of the interactions they foster outweigh dissipative costs. However, for sufficiently large cities, costs grow at a faster rate than interactions fostered, and this places a limit on how large cities can grow.
Bettencourt’s model is based on four assumptions.
- Mixing populations. A resident at any point in the city should be able to commute daily to any other point in the city. As discussed in our analysis of Marchetti’s Constant (see Marchetti (1994)), the city size is then very roughly defined a 30 minute commute radius around a central business district.
- Incremental network growth. Because cities grow incrementally and naturally, infrastructure networks (roads, water, electric, etc.) are decentralized. A consequence of this, in light of the first assumption, is that travel paths are generally not straight lines, nor should residents at the city fringe expect highway speed travel to the city center.
- Bounded human effort. As noted in the next assumption, socioeconomic quantities are modeled to grow with the number of interactions between people, but this can lead to a problem where, as a city grows, the number of interactions required is too great for an individual person. Bettencourt resolves this by assuming that individual effort does not grow unbounded.
- Socioeconomic outputs are proportional to social interactions. This captures the intuition that a city is not merely a collection of people who live near each other, but rather wealth is created through the interactions between them. This point is emphasized by Jacobs (1969).
The last assumption is most concerning because of the local manner in which interactions are defined. Bettencourt considers interactions as local and bounded by the region that a resident is able to travel in a daily commute. However, interactions can also be non-local, mediated by telecommunications rather than face-to-face contact and by less frequent, long-distance travel such as long-distance road trips and aviation. For these reasons, it may be that smaller cities have a relative advantage to Bettencourt’s model and thus the strength of the scaling relationship may be less than what Bettencourt assesses.
While sounding plausible, the “death of distance” argument does not appear to be well-supported. For example, our analysis of the pace of life finds that cell phone call volume tends to be higher in denser cities, suggesting that telecommunications and local interactions are complements, not substitutes. Nevertheless, we will see that most analyses find scaling exponents that are weaker than Bettencourt’s (2013) theoretical model, and there are challenges to the model on methodological grounds.
Empirical Findings
Now that we have considered some theory on how city output should vary with size, let us consider some empirical results.
Bettencourt et al. (2007) is a foundational paper in the field of urban scaling with an approach inspired by physics. Drawing upon several national data sources and performing regressions of various socioeconomic quantities against city size, they find scaling relationships that are generally stronger than others we consider. For example, they find that gross domestic product varies with the 1.15, 1.26, and 1.13 powers of population using data from China (2002), the European Union (1999-2003), and Germany (2003) respectively. Note that the EU scaling relationship is well above that predicted by the theoretical model. Metrics related to research and development show particularly strong scaling relationships: for example, new patents and private research and development employment scale with the 1.27 power of population (United States, 2001) and the 1.34 power population (U.S., 2002) respectively. Some negative quantities also show superlinear scaling. For example, new AIDS cases and serious crimes increases with the 1.23 (U.S. 2002-2003) and 1.16 (U.S. 2003) powers of population. Infrastructural quantities, as predicted by the theory, show sublinear scaling. Both in Germany in 2002, the lengths of electrical cables and total road surface increase with the 0.87 and 0.83 powers of population.
Additionally, Bettencourt et al. (2007) model city growth dynamics. They posit the following growth equation:
\[\frac{dN(t)}{dt} = \left(\frac{Y_0}{E}\right) N(t)^{\beta} - \left(\frac{R}{E}\right) N(t).\]In most biological systems, β<1, meaning that as the system grows, the negative term outgrows the positive term and results in a limit to the system’s growth. The same condition may apply to a city, or it may be that β>1, meaning that the system will grow in an unbounded manner until it reaches a physical limit.
Bettencourt et al. (2010), interested in the ways that cities deviate from the predictions from scaling laws, introduce the idea of Scale-Adjusted Metropolitan Indicators (SAMIs). Popular rankings of cities, such as on incomes and crime, typically compare these metrics across cities on a per-capita basis. Under scaling theory, it is typically large cities that have high incomes and high crime. By contrast, SAMIs measure the deviation of these metrics for a city from what would be predicted by scaling laws. The authors find that SAMIs tend to remain relatively constant for a city over time, even as its size changes drastically.
Bettencourt (2013) also presents findings based on Metropolitan Statistical Areas (MSAs) in the United States for the year 2006. Performing a regression of gross metropolitan product against population, Bettencourt finds that the best fit is that output scales with the 1.126 power of size. The 95% confidence interval is 1.126 ± 0.023 with a remarkably high R² value of 0.96, meaning that population explains most of the variation in output. However, the theoretical value of 7/6 (1.1666…) lies above the upper end of the confidence interval, suggesting that the scaling is not as strong as the model would predict. Bettencourt also finds that the number of lane-miles scales with the 0.849 ± 0.038 power (95% confidence interval) of population, this time containing the theoretical value of 5/6 = 0.8333…, but with a less impressive R²=0.65.
Here, a “city” is defined as a metropolitan statistical area, as defined by the U.S. Office of Management and Budget. These regions, which generally do not correspond to the political boundaries of a city, refer to a central city and surrounding areas that function as a unified labor market with a high degree of social and economic integration.
Lobo et al. (2013) examine 942 cities in the United States as of 2011 and find that the elasticity of total output with respect to population size is 1.146. Equivalently, if a city size doubles, then per-capita output increases by just under 11%. These values are close to the theoretical elasticity of 7/6 that is argued by Bettencourt (2013). Size fits the per-capita output data well.
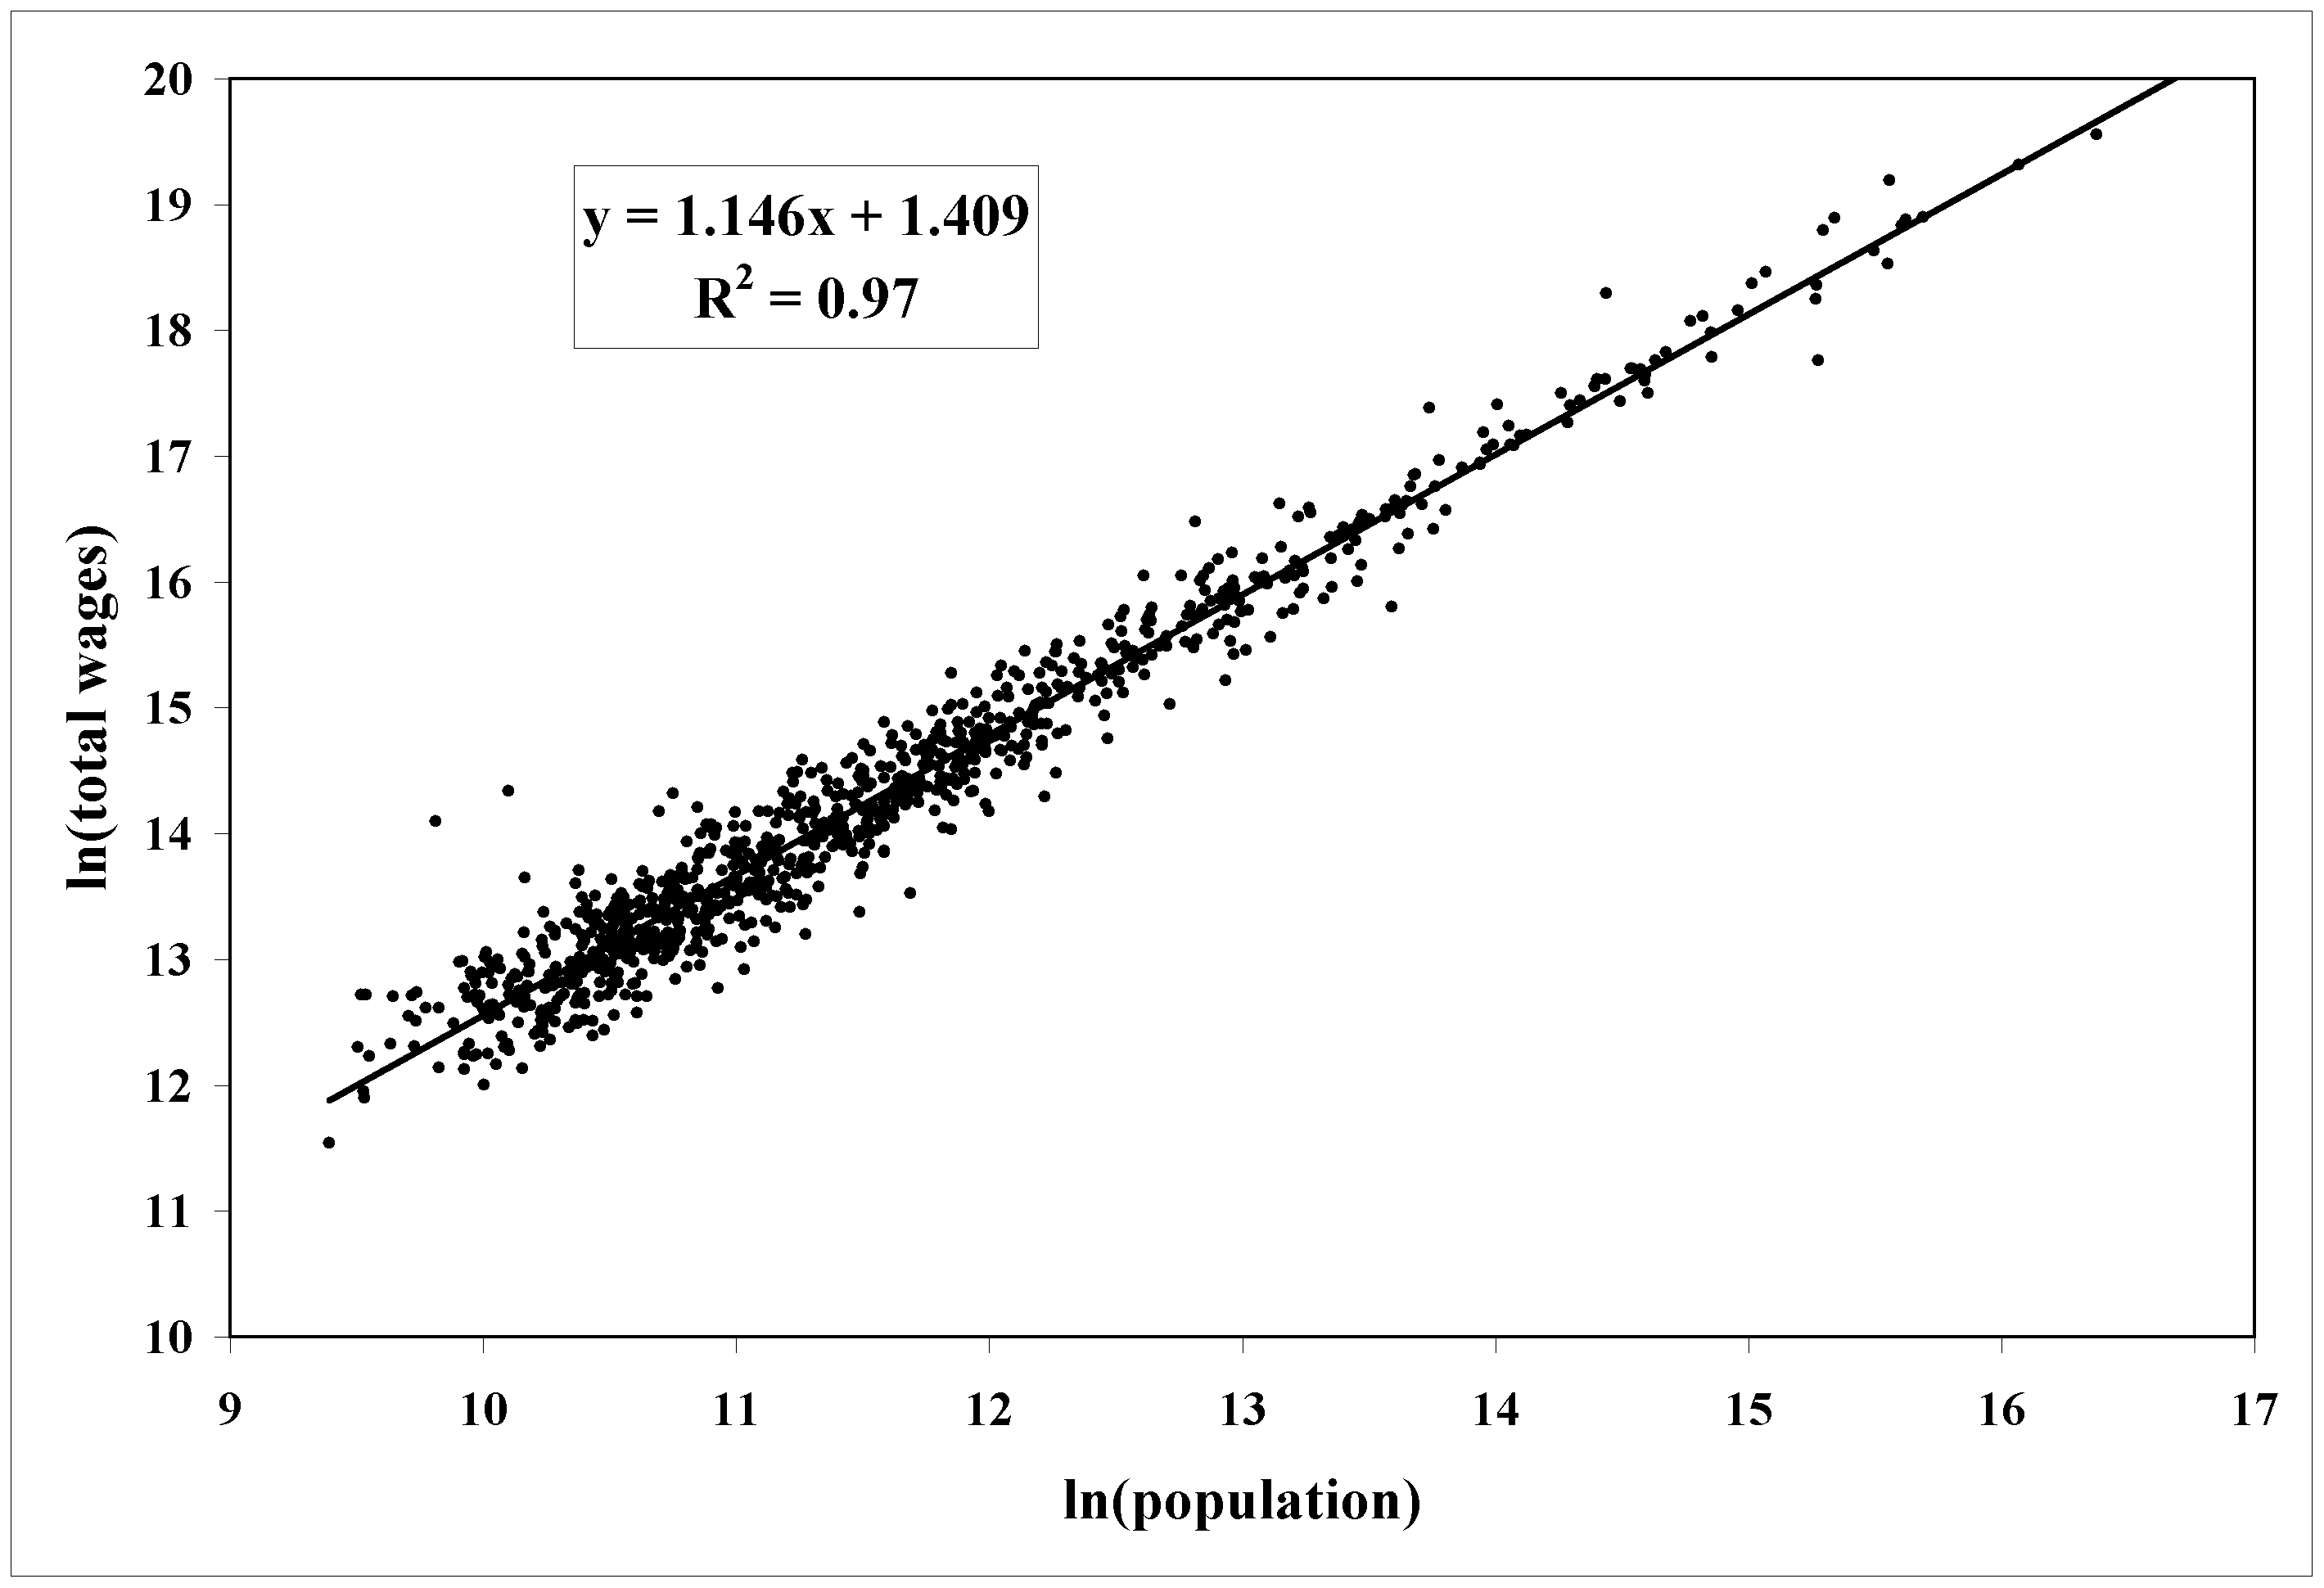 Per-capita output and city size. Image from Lobo et al. (2013).
Similar to Bettencourt (2013), Lobo et al. define cities as metropolitan or micropolitan statistical areas. These regions roughly correspond to labor markets that are unified under a feasible daily commute.
Lobo et al. (2013) estimate a residual ξ for each city, a deviation between the predicted output, given the city’s size, and the actual output. They proceed to estimate a residual ξᴬ, which is the deviation between the predicted total factor productivity (TFP) of a city and the actual TFP. Here, TFP is the portion of output for an economy that is not explained by the total labor force of capital deployment. Wage data, or return to labor, was available, but data to directly measure the capital deployment across cities was not available, and so the authors estimate this quantity by assuming that labor’s share of income is 0.7. Gross metropolitan product data was also available, and so all of these values allow TFP to be calculated. Once residuals are estimated to account for the size of a city, there is no obvious pattern as to which cities have higher TFP.
Melo et al. (2017) consider agglomeration at a smaller scale than a full metropolitan region. Considering the 50 largest metros in the United States, they find the elasticity of wages with respect to job density and the number of jobs available within a given travel time are, respectively, 0.072 and 0.096. These results confirm a prediction of the standard urban model that areas with higher access to jobs are more desirable, manifested through higher wages. The two variables of interest are highly correlated, but the fact that job access shows a greater influence on wages than job density suggests that urban planners would be advised to prioritize transportation access over density.
Schläpfer et al. (2014) does not consider economic output directly, but rather they examine social interaction, for which mobile phone connectivity is taken to be a good proxy. Recall that in Bettencourt (2013), output was assumed to be proportional to social interaction. They find that in Portugal, the 92-day call volume scales with the 1.10 (1.08-1.11) power of city size, whereas in the United Kingdom, the 31-day call volume scales with the 1.10 (1.07-1.14) power of city size. There are various other metrics related to the call data set, all of which show similar scaling properties. One thing especially interesting about the paper is that they find that, for two of a given person’s contacts, the probability that they are themselves connected is independent of city size, which challenges the popular notion that larger cities are more atomizing than small towns.
Skeptical Results
Not all papers have found robust evidence for superlinear urban scaling. Arcaute et al. (2015) examine several socioeconomic characteristics against population size for cities in England and Wales. They find that most per-capita characteristics, including several measures of incomes, do not show a relationship with size. Of those that do, including patents per capita, the relationship is sensitive to the precise way in which cities are delineated. The authors determine city boundaries through aggregation of statistical areas with different density cut-offs. Unlike most other results considered here, this procedure does not make explicit reference to commuting patterns.
Cottineau et al. (2017) find that the observed scaling laws are highly sensitive to the way in which city boundaries are determined. They consider about 5000 ways in which cities in France may be defined, based on combinations of variables on density, commuting patterns, and population cutoffs. For example, more restrictive definitions of cities replicate the finding that total road area grows sublinearly in city size. However, they find that with more expansive definitions of cities, road area tends to grow superlinearly in city size.
Total city area is a metric for which Cottineau et al. (2017) find extreme variations in scaling behavior, depending on how the city is defined. City area was found to vary with population with an exponent as low as 0.334 and as high as 1.291. The high exponent implies that area grows faster than population, or that larger cities also provide more space per capita. The low exponent implies that density rises sharply with population.
Leitão et al. (2016) challenge the statistical methods used in much of the analysis that finds superlinear or sublinear scaling. They examine 15 datasets across five countries around the world and apply several statistical models to estimate the scaling exponent. Most models surveyed above apply a least squares error estimate to a plot of the logarithm of the city’s population and the socioeconomic quantity under consideration. These models then find a scaling exponent β for which the 95% confidence interval does not contain 1, providing strong evidence of superlinear (β>1) or sublinear (β<1) scaling. However, this approach tacitly assumes that the deviations from the best fit are independent and normally distributed. If this assumption is false, it may lead us to overestimate the model’s goodness of fit and our level of confidence in the estimate of β. The authors apply several statistical models to the data sets. They find that the data is rarely compatible with the proposed models, and the Gaussian model, which is commonly used in scaling research, is not the best fit for any of the data sets. Depending on specification, models are usually dominated by small cities, which comprise the majority of cities, or by large cities, which are home to the majority of the population.
Nevertheless, Leitão et al. (2016) find that, in some cases, the findings of superlinear or sublinear scaling are robust to the model specification. This is true specifically for GDP in the United States and in Brazil, as well as museum usage in the European Union. Road area in the U.S., library usage in the EU, and AIDS cases in Brazil show robust evidence of sublinear scaling. In contrast with previous results, patents in the United Kingdom and in the OECD appear to scale linearly with city size. In other cases, the evidence was inconclusive.
Where Scaling Breaks Down
A contested point in the urban scaling literature is whether a fixed scaling exponent β is appropriate for all city sizes. There are several results which suggest that a scaling relationship may break down for very small or very large cities, or that there are phase changes rather than smooth changes as a city grows.
Sutton et al. (2020) examine 67 indicators related to crime, age, property, and mortality in cities in England and Wales. For most indicators, the authors find a critical density of 27 people per hectare–typical of a low-density single-family suburb–below which the indicators do not show signs of scaling. Furthermore, they show that the apparent scaling for denser cities is the result of denser cities attracting more young adults, rather than a genuine scaling effect. The thresholds for the indicators vary and are generally between 10 and 70 people per hectare. The regions analyzed consist of 348 regions in England and Wales and are based on density rather than overall size. Gomez-Lievano, Youn, and Bettencourt (2012) examine crime rates in cities in Brazil, Colombia, and Mexico. They argue that since some events such as homicides are rare, the apparent failing of scaling laws for very small cities is a result of statistical noise rather than an actual failing.
For large cities, Crosato, Nigmatullin, and Prokopenko (2018) find that the urban form may undergo a phase transition, rather than showing continuity. They build a model, exemplified by Greater Sydney, that shows a phase transition as a city transforms from being monocentric–with a single major center of economic activity–to polycentric, or with multiple centers of activity. This has unclear implications for how scaling develops.
One particular challenge in the data of Bettencourt et al. (2007) and others is that they work cross-sectionally–considering a set of cities at a given point in time–rather than longitudinally–or how a city’s socioeconomics might change as the population changes over time–even as the latter may be more relevant for policy. This distinction is important. For example, Keuschnigg (2019) examines wages in 73 labor market areas in Sweden from 1990 to 2012. He finds, as scaling theory predicts, that at a given point in time, average wages grow by 9.4% as population doubles. However, with the exception of the largest markets, he does not find that population growth predicts wage growth in a given market over time.
Unreviewed as of this writing, Marquis and Barthelemy (2026) also argue that policymakers derived flawed conclusions about the evolution of individual cities over time by examining cross-sectional data. They observe, based on a world dataset about city area and population, that in recent years, cross-sectional analysis suggests that cities decrease in density with higher population, but longitudinal analysis suggests that they increase in density with population. They also find, considering data on metropolitan areas in the United States, that longitudinal analysis finds much stronger wage growth with rising population than cross-sectional analysis.
The Objection of Causality
Lobo et al. (2013) state the following caveat.
To be clear, we do not claim that there is a causal relation between urban scaling and urban productivity; scaling reveals a systematic relationship between urban population size and productivity, which itself is a manifestation of a more general relationship between population size and productivity.
Melo et al. (2017) elaborate with two specific problems that challenge empirical measurement of urban scaling. First, there might be unobserved variables that correlate with output, and so a measurement of output in terms of size may actually be capturing some other cause of output. The second problem is reverse causality. It is possible that metropolitan areas that are more productive for reasons unrelated to size, such as favorable geography or good governance, attact more residents, and so higher output causes higher population, rather than the reverse.
To address the reverse causality issue, Melo et al. note that the most common solution is an instrumental variable analysis between long-lagged measures of urban agglomeration and geographic or geological variables. Combes et al. (2010) apply this approach in a measurement of the elasticity of wages against density in France. Without attempting to correct for unobserved variables or reverse causality, Combes et al. find that the elasticity is about 0.05. They consider possible endogenous sources of a relationship between density and wages: more productive workers may prefer to live in denser areas, and more productive cities may attract more workers. Controlling for all these sources of bias reduces the observed elasticity to 0.027. The authors find a further reduced elasticity to 0.02 when they account for the spillover of agglomeration effects across spatial boundaries.
After all the corrections, Combes et al. (2010) do still find an agglomeration effect, albeit one much more modest than that of the theoretical model of Bettencourt (2013). However, it is not clear that Combes et al. account for every conceivable endogenous variable.
Consequences for Policy
To maximize a nation’s wealth, theoretical models and empirical observations suggest that supporting large city development is important. The model of Bettencourt (2013) and many other models demonstrate that city size is determined by an equilibrium between the benefits and the costs of agglomeration. There are two paths to increasing city size under Bettencourt’s model. The first is to increase the value of agglomeration by reducing the downsides, such as by more effective law enforcement to reduce crime. The second approach is to, as presented by Bettencourt, reduce dissipative power of infrastructure. Zakharenko (2016), for example, models that the arrival of autonomous vehicles will increase city size by reducing the amount of parking required next to destinations. Under Bettencourt’s model, parking can be considered a form of power dissipation.
However, planners should be careful not to overestimate the value of agglomeration effects. We have seen that many empirical findings of the elasticity of economic output to population size are less than the theoretical prediction of Bettencourt (2013), including Bettencourt’s own figures. Furthermore, as shown in Combes et al. (2010), observed agglomeration effects may be significantly less than suggested by a naive regression when one accounts for the possibilities of reverse causation and unobserved variables. Planners should, to the maximum extent feasible, base their decisions on tangible agglomeration benefits alongside theoretical scaling models.
Finally, planners should consider the goal of maximizing economic output along other social goals, such as environmental concerns, risks that may arise from too heavily concentrating economic activity in a small number of cities, and regional inequities.
References
Lobo, J., Bettencourt, L., Strumsky, D., West, G. “Urban scaling and the production function for cities”. PLoS ONE 8(3). 2013.
Bettencourt, L. “The Origins of Scaling in Cities”. Science 340(6139), pp. 1438-1441. June 2013.
Marchetti, C. “Anthropological Invariants in Travel Behavior”. Technological Forecasting and Social Change 47(1), pp. 75-88. September 1994.
Jacobs, J. The Economy of Cities. Random House. ISBN 039470584X. 1969.
Melo, P.C., Graham, D.J., Levinson, D., Aarabi, S. “Agglomeration, accessibility and productivity: Evidence for large metropolitan areas in the US”. Urban Studies 54(1), pp. 179-195. January 2017.
Combes, P.P., Duranton, G., Gobillon, L., Roux, S. “Estimating agglomeration economies with history, geology, and worker effects”. In Agglomeration Economics (pp. 15-66). University of Chicago Press. February 2010.
Schläpfer, M., Bettencourt, L.M., Grauwin, S., Raschke, M., Claxton, R., Smoreda, Z., West, G.B., Ratti, C. “The scaling of human interactions with city size”. Journal of the Royal Society Interface 11(98): 20130789. September 2014.
Zakharenko, R. “Self-driving cars will change cities”. Regional science and urban economics 61, pp. 26-37. November 2016.
Bettencourt, L.M., Lobo, J., Helbing, D., Kühnert, C., West, G.B. “Growth, innovation, scaling, and the pace of life in cities”. Proceedings of the National Academy of Sciences 104(17), pp. 7301-7306. April 2007.
Bettencourt, L.M., Lobo, J., Strumsky, D., West, G.B. “Urban Scaling and its Deviations: Revealing the Structure of Wealth, Innovation and Crime across Cities”. PloS ONE 5(11): e13541. November 2010.
Arcaute, E., Hatna, E., Ferguson, P., Youn, H., Johansson, A., Batty, M. “Constructing cities, deconstructing scaling laws”. Journal of the Royal Society Interface 12(102): 20140745. January 2015.
Cottineau, C., Hatna, E., Arcaute, E., Batty, M. “Diverse cities or the systematic paradox of Urban Scaling Laws”. Computers, Environment and Urban Systems 63, pp. 80-94. May 2017.
Leitão, J.C., Miotto, J.M., Gerlach, M., Altmann, E.G. “Is this scaling nonlinear?”. Royal Society Open Science 3(7). July 2016.
Sutton, J., Shahtahmassebi, G., Ribeiro, H.V., Hanley, Q.S. “Rural–urban scaling of age, mortality, crime and property reveals a loss of expected self-similar behaviour”. Scientific Reports 10(1): 16863. October 2020.
Gomez-Lievano, A., Youn, H., Bettencourt, L.M. “The Statistics of Urban Scaling and their Connection to Zipf’s Law”. PloS ONE 7(7): e40393. July 2012.
Crosato, E., Nigmatullin, R., Prokopenko, M. “On critical dynamics and thermodynamic efficiency of urban transformations”. Royal Society Open Science 5(10): 180863. October 2018.
Keuschnigg, M. “Scaling trajectories of cities”. Proceedings of the National Academy of Sciences 116(28), pp. 13759-13761. July 2019.
Marquis, U, Barthelemy, M. “On the Meaning of Urban Scaling”. ArXiv. May 2026 (v. 2).