As societies grow, they may run a risk of depleting critical resources. Here we review some general concepts in assessing natural resource availability and consider a few specific cases.
Reserves and Resources
Meinert, Robinson, and Nassar (2016) consider the distinction between “reserves” and “resources” in the context of mineral availability. According to Meinert, Robinson, and Nassar, three levels of availability can be considered.
- Reserves are those minerals whose existence is known with a high probability and that can be expected to be recovered economically with today’s prices and technology. Reserves are commonly expressed as X tons of reserves with an average grade of Y and a cutoff grade of Z.
- Resources are those minerals whose existence is less certain and may be at a grade too low to be economically recovered economically at today’s prices and technology. All reserves are resources, but not all resources are reserves.
- “All there is” refers to all of a mineral that might be recovered in the future. Unlike “reserves” and “resources”, “all there is” is not is not a standard term, though ultimate recoverable resource is sometimes used. Estimates of the ultimately recoverable resources is typically very speculative. “All there is” encompasses all reserves and resources and is potentially much larger.
The classification between reserves and resources is widely used among the industry and government agencies, including the United States Geological Survey, as described by Falkie and McKelvey (1976). The USGS further distinguishes both reserves and resources into demonstrated–the sum of measured and indicated resources–and inferred–those resources that are not demonstrated but whose existence can be determined with reasonable confidence based on the geological characteristics of a deposit. In turn, measured resources are those whose tonnage is computed from direct measurements, and indicated are those resources whose tonnage is partially computed from direct measurements. Those minerals that are not reserves or resources are in turn classified as hypothetical resources, whose existence can reasonably be expected, and speculative resources, either those for which evidence of existence is unknown or types of deposits that may later be recognized as reserves.
The classification of minerals has been illustrated by the McKelvey diagram, or the McKelvey box, named for former U.S. Geological Survey director Vincent McKelvey and described by Brobst, Pratt, and McKelvey (1973).
 Illustration of a McKelvey diagram, as presented by the United States Geological Survey (2025)
Despite the well-established distriction between reserves and resources, and the fact that both can grow with new discoveries, Meinert, Robinson, and Nassar (2016) find that resource shortage forecasts routinely conflate current reserves with “all there is”. The 1972 report The Limits to Growth (Meadows et al. (1972)), for instance, estimated that if exponential growth in usage continued and actual reserves were five times the values known at the time, then copper, gold, mercury, natural gas, petroleum, silver, and zinc should have run out by 2025. If actual reserves were instead taken to be equal to known reserves at the time, then aluminum, lead, manganese, molybdenum, nickel, platinum group metals, and tin should also have run out.
The metric of reserve to production ratio (R/P) is frequently used to assess the long-term availability of a resource. Wellmer (2022) offers as a rule of thumb that a healthy mineral supply should be at least 50 years for stratabound (confined to a specific stratigraphic unit) minerals and at least 25 years otherwise. Due to the dynamic nature of reserves, the R/P ratio tells us little about the long-term duration of supplies of a mineral. Despite growing production, R/P ratios have tended to hold constant over time, with some fluctuation.
| Mineral | Year | R/P Ratio | Annual Production |
|---|---|---|---|
| Bauxite | 1970 | 203 years | 57.8 million tons (Mt) |
| Bauxite | 2020 | 82 years | 391.0 million tons (Mt) |
| Copper | 1970 | 36 years | 5.9 Mt |
| Copper | 2020 | 43 years | 20.6 Mt |
| Lead | 1970 | 26 years | 3.39 Mt |
| Lead | 2020 | 21 years | 4.38 Mt |
| Platinum | 1970 | 130 years | 58 tons |
| Platinum | 2020 | 182 years | 166 tons |
| Silver | 1970 | 16 years | 9.360 tons |
| Silver | 2020 | 23 years | 23.500 tons |
| Uranium | 1970 | 75 years | 34.088 tons |
| Uranium | 2020 | 113 years | 54.224 tons |
| Zinc | 1970 | 23 years | 5.6 Mt |
| Zinc | 2020 | 21 years | 12 Mt |
As Wellmer (2022) explains, R/P ratios tend to be roughly constant over time due to market feedback. If R/P falls, either due to a lack of exploration or an unexpected spike in demand, it sends a financial signal to the mining industry to increase exploration. If R/P rises, it sends a financial signal that less exploration is needed, as companies do not want to invest in exploration of minerals that they can only produce in the far future.
As Meinert, Robinson, and Nassar (2016) discuss, there is an apparent paradox between the obvious finitude of all natural resources in the Earth and the fact that no major mineral commodity has run out, despite numerous predictions that resource shortages would occur.
Fossil Fuel Depletion
“Peak oil” refers to an expected worldwide peak, followed by decline, in world oil production.
Hubbert Peak
Peak oil forecasts draw heavily on the Hubbert peak, developed by the petroleum geologist M. King Huubert (Hubbert (1956)). Hubbert observed that fossil fuel production in a region, such as a state in the United States, tends to follow a normal curve, or a bell-shaped curve. Such a curve initially appears to be exponential, showing a certain percentage increase every year, but eventually shows a slowing growth rate, a peak, and then a decline.
Hubbert applied a best fit normal curve to oil and gas production in the United States and forecast that these two commodities should see peak production around, respectively, 1965 and 1975. According to Kriel (2024), the United States saw a peak in oil production in 1970 of 9.6 million barrels per day (mb/d) and a general decline to 5.0 mb/d in 2008, but then oil production rebounded with the deployment of hydraulic facturing and horizontal drilling, reaching a value of 12.9 mb/d in 2023.
A lesser-known aspect of Hubbert (1956) is the advocacy for nuclear power. Written at the dawn of the civilian nuclear industry, and at a time of great expectations for it, Hubbert observes that the energy content of then-known uranium reserves vastly exceeded that of fossil fuel reserves, and with population stabilization in the near future, nuclear power had the potential to power civilization at a high standard of living for millennia.
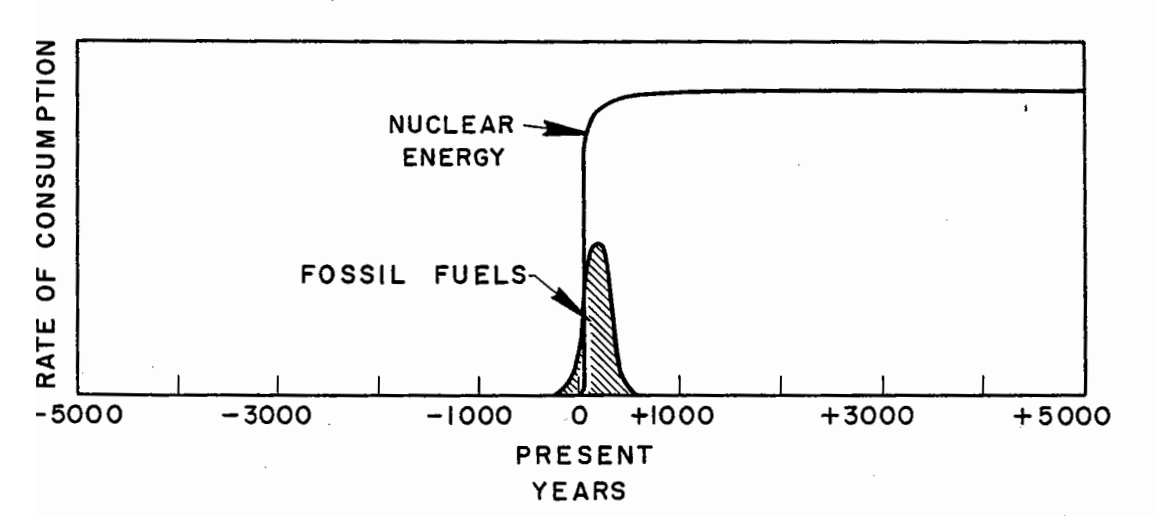 Potential Production of Fossil Fuels and Nuclear Power. Image from Hubbert (1956).
Hubbert’s forecast for United States oil production appeared to be fairly accurate for 50 years after the paper’s publication, but he too failed to foresee the eventual impact of oil production technology from the late 2000s. So far, he has also greatly overestimated the potential of nuclear power, but based on a 5000 year forecast window, the industry’s slow start in the first 70 years might be only a blip.
As Priest (2014) recounts, defenders of the Hubbert peak hypothesis often argue that the model applies to conventional oil and not to deepwater oil or oil obtained from shale, thus abstracting away a principle objection to the Hubbert peak model that it does not account for the role of new technology and price signals.
Peak Oil
The modern peak oil movement began with the short editorial Campbell and Laherrère (1998), which forecast a world peak oil production no later than 2010. The forecast is based on a simple feature of the bell-shaped curve posited by Hubbert (1956): it is symmetric around the peak value, and thus the peak value occurs when cumulative production is half of total eventual production. Campbell and Laherrère estimate the former at 850 billion barrels of oil, and they estimate the latter at 850 billion barrels of proven reserves and 150 billion barrels of reserves that were yet to be discovered. In assessing reserves, Campbell and Laherrère allege that oil companies and national governments of oil-producing nations have systematically inflated their reserve estimates, justifying smaller reserve estimates than most published values at the time.
Hubbert Linearization
Building from earlier work, in 1982 Hubbert introduced Hubbert linearization (Hubbert (1982)), a mathematical technique for estimating ultimate reserves of a resource. It can be shown that a, when annual oil production follows a normal distribution function as posited in Hubbert (1956), the percentage growth rate of production, which is the derivative of annual production, divided by annual production, is a linear function with negative slope. The relationship between annual production Q(t) and the growth rate P(t) is also linear. When they are plotted on a single graph, Hubbert showed that the intersection with the Q axis is the ultimate recoverable reserve.
Rutledge (2011) applies a variant to Hubbert linearization to world coal production. He uses a logistic and a cumulative normal model, linearized respectively by logit and probit transformations, with the particular model for each region chosen by whichever yields a higher correlation coefficient. The model is then applied to 14 world regions, as coal is not widely traded worldwide, and the values from the regions are summed to attain an estimate of remaining world coal reserves. The estimate is a total of 680 billion tons of world production, past and future. This estimate is a bit more than half of the World Energy Council’s estimate and a fifth of those of the Intergovernmental Panel on Climate Change. Rutledge distinguises between “reserves”, which are known coal deposits that can be recovered today economically, and “resources”, which are not reserves but may become reserves under plausible economic conditions. Thus Rutledge does not foresee that absolute resource constraints will limit coal production, but rather economic conditions.
Copper
Northey et al. (2014) are among researchers who have recently raised concern over a near-future peak in copper production. Their forecast is at a world peak in copper production will come in the early 2030s, with production nearly ceasing by 2100. Their estimate uses an estimate of the ultimately recoverable reserve from Mudd et al. (2013) of about 1860 million tons (Mt), close to the estimate of the United States Geological Survey noted below. With an estimated URR, the authors apply the Geologic Resources Supply – Demand Model (GeRS-DeMo) model, developed by Mohr (2010) to model a peak in fossil fuel production. The GeRS-DeMo model consists of a supply side, which models production from individual mines as being mostly flat over time, with a ramp-up and ramp-down period, and a demand side, which is based on population and GDP projections and observed per-capita copper demand at various levels of wealth. The model allows for the interaction between supply and demand, whereby high demand can induce producers to develop mines faster. However, we suspect that Northey et al. (2014) underestimates the URR, and thus places peak production too early and at too low a level, because their URR does not respond dynamically to price signals or advances in technology.
Calvo et al. (2016) raise concern about declining copper ore grades. In Chile, the world’s top copper-producing country, ore grade declined by about 25% from 2003 to 2013. Over the same period, energy consumption increased by 46%, while copper production increased by 30%, for an energy intensity increase of about 12%. When ore grades are lower, more material must be processed to produce a given amount of copper, leading to higher energy consumption and other undesired environmental impacts. However, Rötzer and Schmidt (2018) challenge the common narrative, implied by Northey et al. (2014) and Calvo et al. (2016), that declining ore grades are a sign of mineral depletion. Focusing on copper, Rötzer and Schmidt (2018) review several technological advances throughout the 20th century that have converted overburden into ore, including the Jackling method for open pit mining, mechanization of mines, and froth flotation. They argue that the observed decline in ore grades is primarily a function of increasing production–high grade deposits still are known and produced–and it does not provide any evidence for resource depletion.
Meinert, Robinson, and Nassar (2016) find that historical cumulative copper production from 1700 to 2015 was 648 Mt. Citing Johnson et al., they report copper resources of 2100 Mt and undiscovered resources of an additional 3500 Mt. According to Flanagan (2025), reserves as of 2024 were at 980 Mt and mine production was at 23 Mt, yielding a R/P ratio of almost 43 years.
According to the International Copper Association (2022), 32% of the copper used worldwide from 2009 to 2018 was sourced from recycling. Wang et al. (2021) find that copper’s recycling rate is about 40%. While copper is theoretically reusable indefinitely, 100% recycling is infeasible due to the low quality of much copper scrap. They nonetheless assess a potential to increase recycling rates–saving 15% of energy associated with copper production with the maximum feasible recycling rates–as well as to increase yield (i.e. decrease loss) in the manufacturing of copper semis, to improve material efficiency, and to substitute for copper in some applications.
While deep sea mining remains controversial, and the ecological implications are not fully understood, the European Academics Science Advisory Council (2023) assesses that copper, as well as manganese, cobalt, nickel, zinc, silver, and gold can all be recovered through deep sea mining. Petersen et al. (2016) assess that the copper available in nodules in the Clarion-Clipperton Zone in the Paciic Ocean amounts to 226 million tons, about 30% of the terrestrial reserves at the time. Diallo, Kotte, and Cho (2015) argues that, while still speculative, recovery of minerals such as copper that are dissolved in sea water may be possible with technological advances and integration with desalination plants. Finally, Łuszczek and Krzesińska (2020), by analyzing the chemical composition of chondrites, which as originate from S-type asteroids, estimate that the asteroid 6 Hebe, which contains 0.5% of the mass of the asteroid belt, may contain up to 1.39 trillion tons of copper, dwarfing estimates of terrestrial copper reserves. Łuszczek and Krzesińska (2020) stress that asteroid mining will not be economically feasible for the foreseeable future.
References
Hubbert, M. K. “Nuclear Energy and the Fossil Fuels”. Houston, TX: Shell Development Company, Exploration and Production Research Division. March 1956.
Kriel, E. “United States produces more crude oil than any country, ever”. United States Energy Information Administration. March 2024.
Priest, T. “Hubbert’s Peak: The Great Debate over the End of Oil”. Historical Studies in the Natural Sciences 44(1), pp. 37-79. February 2014.
Campbell, C.J., Laherrère, J.H. “The end of cheap oil”. Scientific American 278(3), pp. 78-83. March 1998.
Rutledge, D. “Estimating long-term world coal production with logit and probit transforms”. International Journal of Coal Geology 85(1), pp. 23-33. January 2011.
Hubbert, M. K. “Techniques of Prediction as Applied to the Production of Oil and Gas”. 1982.
Meinert, L.D., Robinson Jr., G.R., Nassar, N.T. “Mineral resources: Reserves, peak production and the future”. Resources 5(1): 14. February 2016.
Falkie, T. V., McKelvey, V. E. “Principles of the Mineral Resource Classification System of the U.S. Bureau of Mines and U.S. Geological Survey”. Water Resources Division, United States Geological Survey, Bulletin 1450-A. 1976.
Brobst, D. A., Pratt, W. P., McKelvey, V. E. “Summary of United States Mineral Resources”. United States Geological Survey. 1973.
United States Geological Survey. “Mckelvey Diagram”. Accessed February 7, 2025.
Meadows, D. H., Meadows, D. L., Randers, J., Behrens, W. The Limits to Growth. The Club of Rome. 1972.
Johnson, K.M., Hammarstrom, J.M., Zientek, M.L., and Dicken, C.L., 2014, “Estimate of undiscovered copper resources of the world, 2013”. U.S. Geological Survey Fact Sheet 2014–3004, 3 p. 2014.
Flanagan, D. M. “Copper”. United States Geological Survey. January 2025.
Wellmer, F.-W. “What we have learned from the past and how we should look forward”. Mineral Economics 35, pp. 765-795. March 2022.
Northey, S., Mohr, S., Mudd, G.M., Weng, Z., Giurco, D. “Modelling future copper ore grade decline based on a detailed assessment of copper resources and mining”. Resources, Conservation and Recycling 83, pp. 190-201. February 2014.
Mudd, G.M., Weng, Z., Jowitt, S.M. “A detailed assessment of global Cu resource trends and endowments”. Economic Geology 108(5), pp. 1163-1183. August 2013.
Mohr S. Projection of world fossil fuel production with supply and demand interactions. Doctoral dissertation, University of Newcastle. 2010.
Calvo G, Mudd G, Valero A, Valero A. “Decreasing ore grades in global metallic mining: a theoretical issue or a global reality?”. Resources 5(4): 36. November 2016.
Rötzer, N., Schmidt, M. “Decreasing metal ore grades—Is the fear of resource depletion justified?”. Resources 7(4): 88. December 2018.
European Academics Science Advisory Council. “Deep-Sea Mining: assessing evidence on future needs and environmental impacts”. June 2023.
Petersen, S., Krätschell, A., Augustin, N., Jamieson, J., Hein, J.R., Hannington, M.D. “News from the seabed–Geological characteristics and resource potential of deep-sea mineral resources”. Marine Policy 70, pp. 175-187. August 2016.
International Copper Associaton. “Copper Recycling”. February 2022.
Wang, T., Berrill, P., Zimmerman, J.B., Hertwich, E.G. “Copper recycling flow model for the united states economy: Impact of scrap quality on potential energy benefit”. Environmental Science & Technology 55(8), pp. 5485-5489. March 2021.
Diallo, M.S., Kotte, M.R., Cho, M. “Mining critical metals and elements from seawater: opportunities and challenges”. Environmental Science & Technology 49(16), pp. 9390-9399. August 2015.
Łuszczek, K., Krzesińska, A.M. “Copper in ordinary chondrites: Proxies for resource potential of asteroids and constraints for minimum-invasive and economically efficient exploitation”. Planetary and Space Science 194:105092. December 2020.